Understanding the Profit and Loss (P&L) statement is crucial for the financial success of any business. Owners, investors, and lenders (stakeholders) can confidently make crucial business decisions by analyzing profit and loss statements. These statements provide valuable insights into the company’s sales generation, cost management, and profit generation capabilities.
Definition and Overview of Profit and Loss Statement
Profit and loss statements are financial reports showing a company’s revenues and expenses over a certain period. The profit and loss statements are also called:
• The Income Statement
• Statement of Operations
• Statement of Earnings
Depending on the needs of the company, the profit and loss statement may be generated:
• Weekly
• Monthly
• Quarterly
• Annually
These statements form a crucial part of the three major financial statements, alongside the balance sheet and cash flow statement. P&L statements allow stakeholders to review financial performance and identify areas for improvement. Reviewing a P&L statement, stakeholders can evaluate the following:
• Revenue trends
• Expense management
• Financial risk Benchmarks
Key Components
Profit and loss statements include revenue, expenses, and net income sections, with other income and expenses subcategories.
A single-step profit and loss statement is a P&L that simply records the company’s revenue and total expenses to calculate the net income.
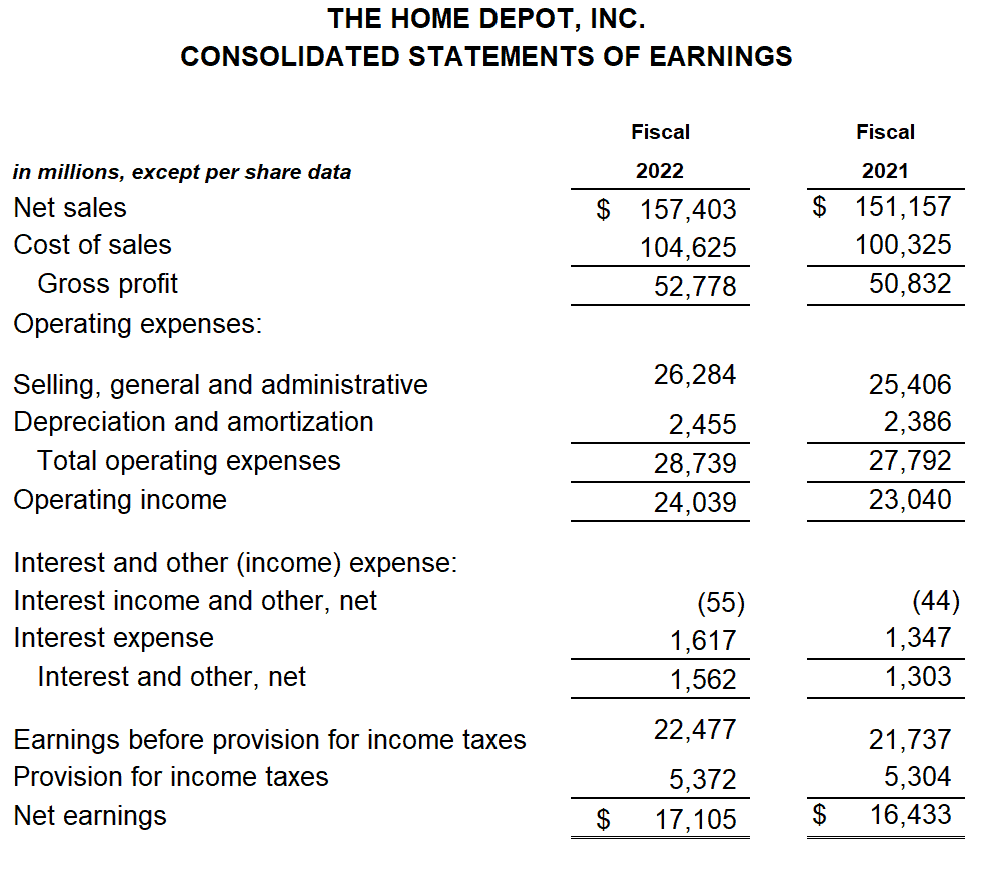
A more detailed approach to profit and loss statements is the multi-step method, which segregates expenses into direct costs and indirect costs, enabling the calculation of gross profit and net operating income. This method provides a more precise understanding of a company’s financial health and helps assess its profit and loss. Below is the P&L statement for Home Depot. This is an example of a multi-step income statement.
The Structure of Profit and Loss Statements
A Profit and Loss Statement comprises several vital components. All examples used are from the Statement of Earnings of Home Depot pictured above for the fiscal year 2022.
Revenue
Revenue is a company’s income from selling its goods or services to customers within a specific timeframe. Gross revenue, sales, income, or turnover can also be called gross revenue. Net revenue includes returns, allowances, and discounts as part of the total revenue. Revenue is a valuable metric for gauging the demand for a company’s offerings and its profitability and potential for growth.
Example: Net sales were $157.4 billion. Sales are recognized net of sales tax. Sales are generated from goods and services.
Cost of Goods Sold
The Cost of Goods Sold includes all the direct costs of manufacturing or buying merchandise. These costs encompass raw materials, direct labor expenses, production overhead, and other direct expenses incurred in manufacturing or procurement. In a service-based company, COGS would include all labor or other expense directly related to providing the services.
Example: Home Depot includes the following cost of goods sold:
- Cost of merchandise
- Labor for services
- Transportation from vendors
- Shipping and handling of goods to the stores
The total cost of sales was $104.6 billion.
Gross Profit
Gross Profit, or Gross Margin, equals revenue less Cost of Goods Sold.
A high gross profit demonstrates that a company keeps expenses related to the cost of goods sold low and can increase revenue with demand or price increases. On the other hand, a low gross profit may signify issues such as higher production costs, pricing pressures, or inefficient resource allocation. It is also essential to compare the gross profit within the industry.
Example: Gross profit was $52.7 billion.
Operating Expenses
Operating expenses are the essential costs incurred in running a business daily. These expenses differ among companies depending on their specific industry. They include expenses such as:
• Sales and marketing
• Administrative
• Depreciation
• Research and development
Example: There are $24 billion of operating expenses in two categories: selling, general, and administrative and depreciation and amortization
Operating Income
Operating income, or Operating Profit or Earnings Before Interest and Taxes (EBIT), is the profit generated from a company’s core operations before accounting for interest expense and taxes. It helps determine the profit or loss from operating activities. It is calculated by subtracting the Operating Expenses from the Gross Margin.
Example: Operating income was $24 billion.
Non-operating Income and Expenses
Non-operating (Other) Income and Expenses refer to additional revenue and expenses unrelated to a company’s primary operations. These include interest income, gains or losses from investments, and unique one-time expenses or income.
Example: Interest income and expenses totaling $1.5 billion.
Net Income
Net income, or Net Earnings, represents the final profit or loss figure obtained after accounting for all revenue, expenses, taxes, and non-operating items. It shows a business’s overall performance and is a crucial metric for shareholders and potential investors.
Example: Home Depot had net earnings of $17 billion in fiscal year 2022.
Analyzing Your Profit and Loss Statement
Regularly reviewing and analyzing Profit and Loss (P&L) statements is crucial for identifying trends, patterns, and areas of improvement within a business. By evaluating financial data over time, companies can gain insights into variations in revenue and expenses. This trend analysis helps recognize areas for growth and improvement.
Comparing current P&L statements with the prior period allows tracking progress and identifying specific areas needing attention. Key performance indicators, such as gross profit margin, operating expenses, and net income, can be assessed to evaluate efficiency and profitability.
By understanding these metrics, businesses can make informed decisions, enhance efficiency, and optimize performance. Monitoring revenue trends, cost management, gross profit margins, operating expenses, and net income growth within the P&L statement help stakeholders assess the business’s financial health and profitability.
Below are three different analyses that can be used to revive the profit and loss statements.
Horizontal Analysis
Horizontal analysis, also known as trend analysis, compares profit and loss statement data over multiple periods to identify and evaluate changes in performance. This is used to analyze a business to forecast future outcomes based on historical information.
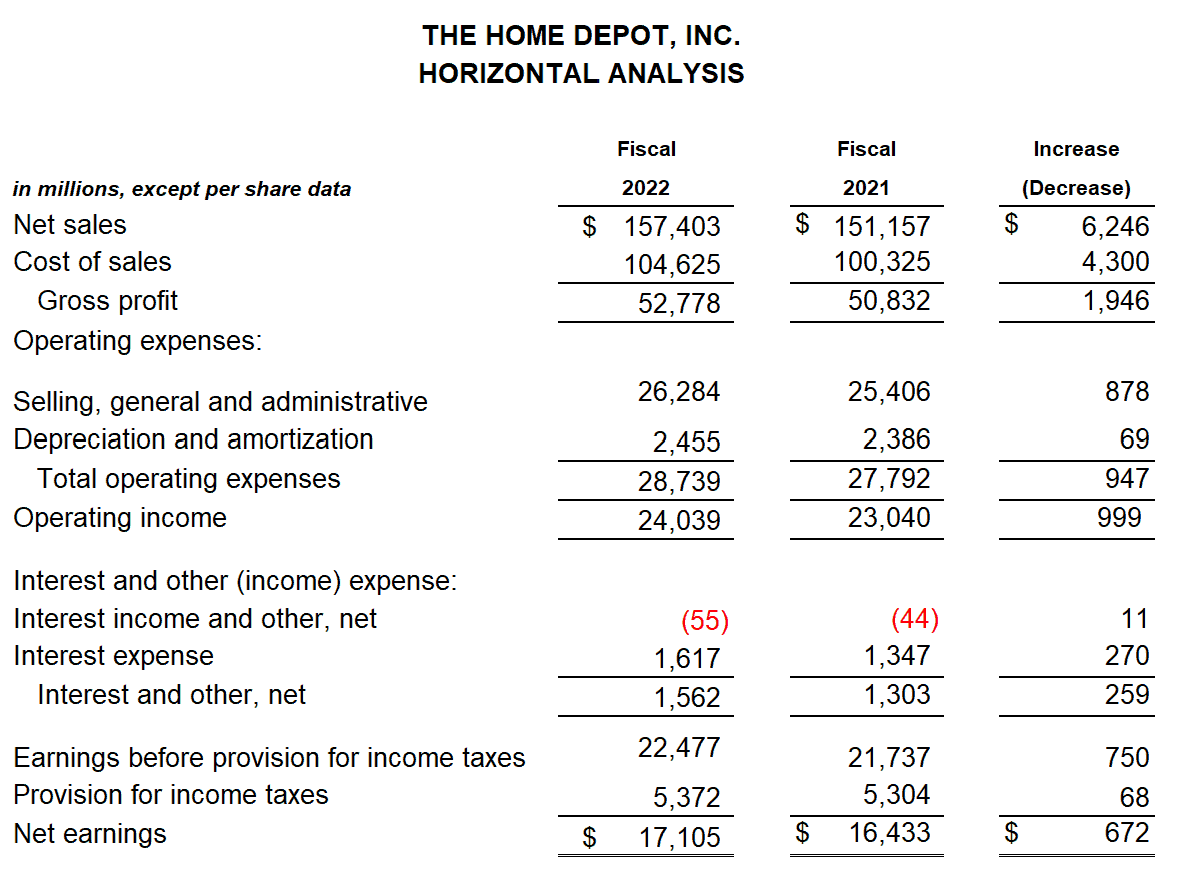
Based on the horizontal analysis above, Home Depot’s gross profit increased by $1.9 billion, and operating expenses increased by $947 million. Including other items and taxes, net earnings increased by $672 million.
Vertical Analysis
Vertical analysis, also called common-size analysis, is a method of financial analysis that expresses each profit and loss statement line item as a percentage of net sales or net revenue. It helps understand the composition and proportion of each expense or income category relative to the company’s total revenue.
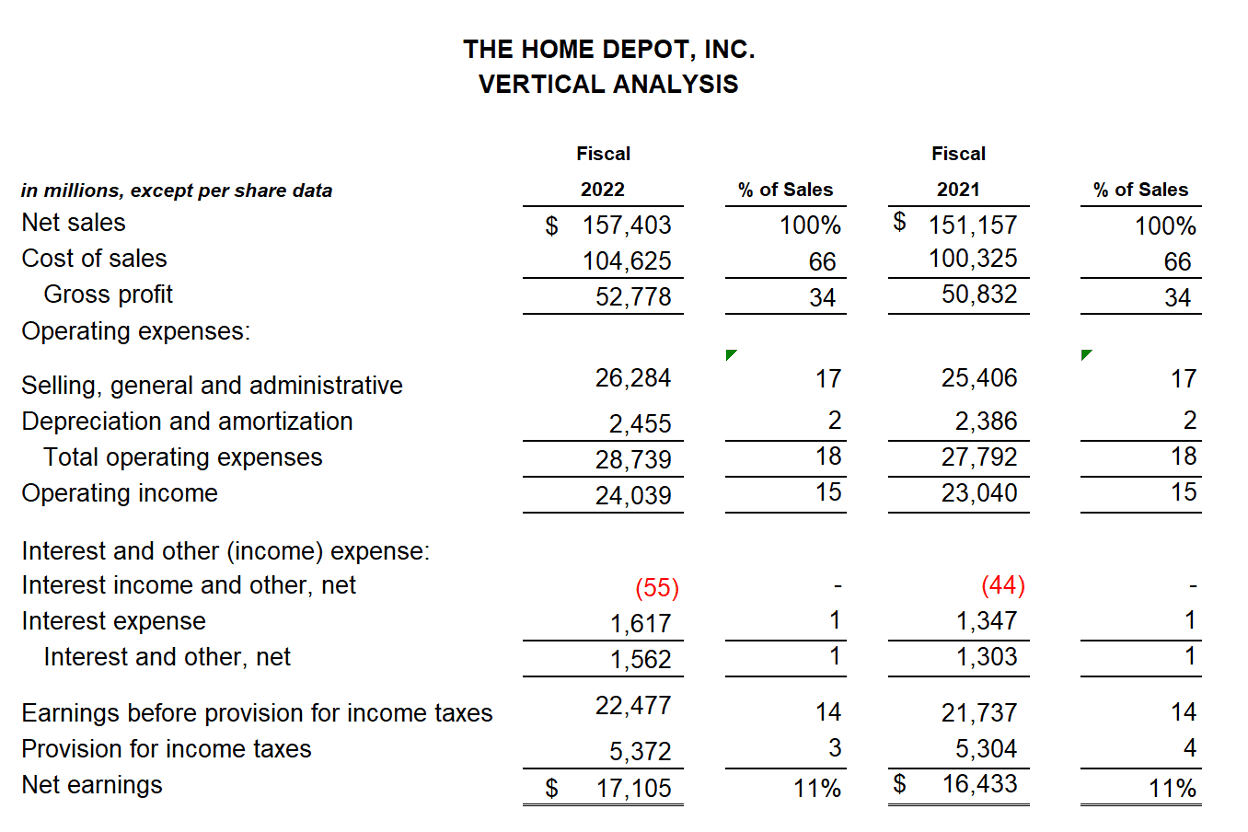
In the example above, the cost of goods sold is 66%, and operating and other expenses are 23% of total revenue. This leaves net earnings of 11%. Even though we saw in the horizontal analysis that the company had increased sales and net earnings on a percentage basis year over year, it was not a significant change. This shows how different analyses can give be used to give a different perspective on the financial statements.
Ratio Analysis
Ratio analysis involves calculating and interpreting various financial ratios derived from profit and loss statement data. These ratios provide insights into the company’s profitability, efficiency, liquidity, and other critical aspects of its operations.
Gross Profit Margin
This ratio measures the percentage of revenue after deducting the cost of goods sold. It is calculated by dividing the gross profit by the revenue.
Operating Profit Margin
Also known as operating margin or return on sales, this ratio indicates the percentage of each dollar of revenue left after deducting the cost of goods sold and operating expenses. It is calculated by dividing operating income by revenue.
Operating Income Margin
This ratio focuses on the operating income and measures the percentage of each dollar of revenue after deducting operating expenses. It is calculated by dividing operating income by revenue.
Net Profit Margin
This ratio represents the percentage of each dollar of revenue that remains as net income after deducting all expenses, including taxes and non-operating items. It is calculated by dividing net income by revenue.
Return on Assets (ROA)
This ratio measures the efficiency in generating profits relative to the company’s assets. It is calculated by dividing net income by total assets.
Return on Equity (ROE)
This ratio measures the return generated for shareholders’ equity. It is calculated by dividing net income by shareholders’ equity. A higher ROE indicates better profitability and efficient use of shareholders’ investments.
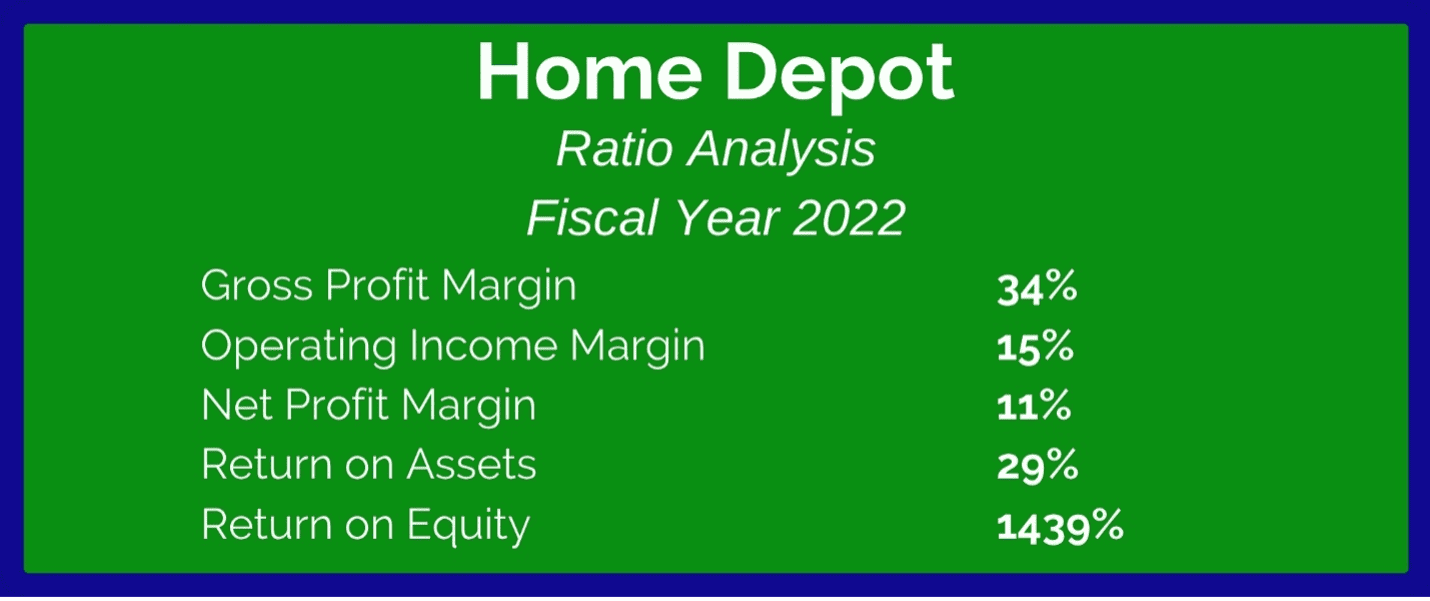
The ratios based on margin are typically compared to other companies within their industry. A net profit margin of 11% may be expected for a home improvement company, while margins for a software company could be above 50%. It’s essential to compare numbers with the right industry.
The return on assets is 29%. This would be considered a great return as the preferred ratio should be above 20% but not below 5%.
A good ROE is between 15 to 20%. An ROE of over 40% is considered exceptional. The ratio above may give the impression that this is a fantastic return, but the company had little equity after it was negative in the prior year. Again, this shows that various analyses are essential when reviewing a company.
Summary
Understanding a company’s financial position is essential for stakeholders to make evaluate a company’s current performance and forecast the future. The Profit and Loss Statement is a critical financial statement providing valuable insights into a business’s financial strength and long-term success. Businesses can improve their profitability and make better decisions by reviewing profit and loss and using the information.